Bitcoin Price Prediction: As BTC Falls Below $112K, Michael Saylor Predicts Bitcoin Will Be `10X Bigger Than Gold’
The Bitcoin price dropped a fraction of a percent in the past 24 hours to trade at $111,561 as of 12:20 a.m. EST
But that did nothing to dampen the spirits of Strategy’s Michael Saylor.
”Bitcoin is the technology version of gold and it’s going to be 10X bigger than Gold,” he said during an interview with CNBC.
Today with @MorganLBrennan, I discussed the differences between Bitcoin, Gold, and other crypto networks — and the rise of Digital Treasury Companies, Digital Credit, and Digital Finance. pic.twitter.com/sdbWWEIq0E
— Michael Saylor (@saylor) September 23, 2025
Meanwhile, Coinbase CEO Brian Armstrong believes that Bitcoin could rally to $1 million by 2030, driven by greater regulatory clarity.
I think Bitcoin could reach $1M by ~2030 based on current conditions and progress.
Think long-term. pic.twitter.com/6MKqrjojAP
— Brian Armstrong (@brian_armstrong) September 24, 2025
Social media sentiment monitor Santiment says ”buy the dip” mentions have surged to the highest level in 25 days, but warns that doesn’t mean a quick rebound is coming.
”Prices typically move the opposite direction of the crowd’s expectations,” it said. ”So if retail traders believe that $112.2K is finally the time to buy, then a little more pain needs to be felt. Once the crowd stops feeling optimistic, and they begin to sell their bags at a loss, this is typically the time to strike with your dip buys.”
Bitcoin Price: Still Riding The Rising Channel Despite The Drop
The BTC price on the 3-day timeframe shows that the asset is moving in a well-established uptrend within a rising channel pattern.
Since late 2023, the Bitcoin price has steadily advanced, respecting both the upper and lower boundaries of this channel. Recently, however, the price of BTC has pulled back from a local high near $123,922 and now trades at approximately $111,561.
This retracement finds BTC hovering near the lower boundary of the channel, which has historically served as strong dynamic support.
A failure to hold this level could open the door to further downside, but as long as the channel structure remains intact, the broader bullish trend remains in play.
Meanwhile, according to the Fibonacci retracement levels, the 0.236 level at $107,515 and the 0.382 level at $97,365 act as critical supports, with the 0.5 retracement at $89,162 serving as a deeper safety net if selling pressure intensifies.
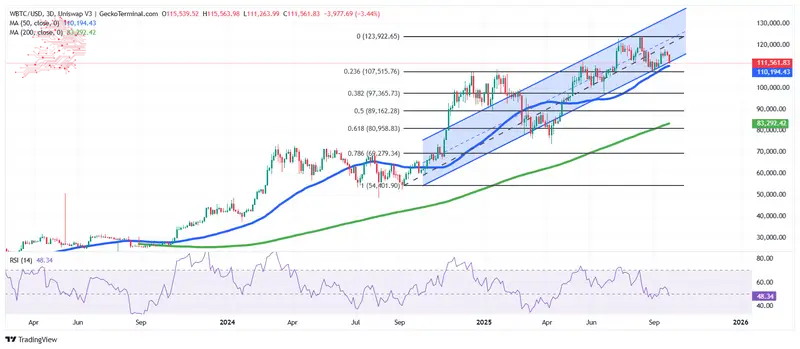
BTC Price Momentum Indicators Support The Uptrend
The Simple Moving Averages (SMAs) on the chart confirm the prevailing strength of the trend. The 50-day SMA sits at $110,194, providing near-term dynamic support that aligns closely with the current BTC price action. Meanwhile, the 200-day SMA at $83,292 remains far below the market, underscoring the longer-term bullish bias.
The Relative Strength Index (RSI) is positioned at 48.34, indicating neutral momentum, leaning toward weakness. This suggests that buying has cooled, and the market may consolidate further before resuming a decisive trend.
If the Bitcoin price holds above the 50-day SMA and the channel support, a rebound toward the $123,922 high is likely, with potential for a breakout into the $125,000–$130,000 range.
Conversely, if the price of Bitcoin breaks below $107,500, a drop toward the $97,000–$89,000 Fibonacci range becomes the more likely scenario.
According to Michaël van de Poppe, a crypto analyst on X with more than 808k followers, BTC could surge past the $115,000 resistance.
I'm interested to see whether $BTC will hold these crucial levels for support.
If that's the case, then $115K upwards would be the next clear resistance point.
If not? Probably another cascade to $106-108K –> max buy zone. pic.twitter.com/1ByLIcYUkD
— Michaël van de Poppe (@CryptoMichNL) September 23, 2025
Related News:
- Ramaswamy’s Strive To Buy Semler Scientific, Creating 11th-Largest Bitcoin Treasury Firm
- WisdomTree Registers Crypto Index Fund Tracking Top 20 Tokens, Including XRP, Solana, Bitcoin
- Trump-Backed World Liberty Financial To Launch Debit Card, Retail App To Bolster USD1


Comments
Post a Comment